



One of the most important dashboards for performance analysis.
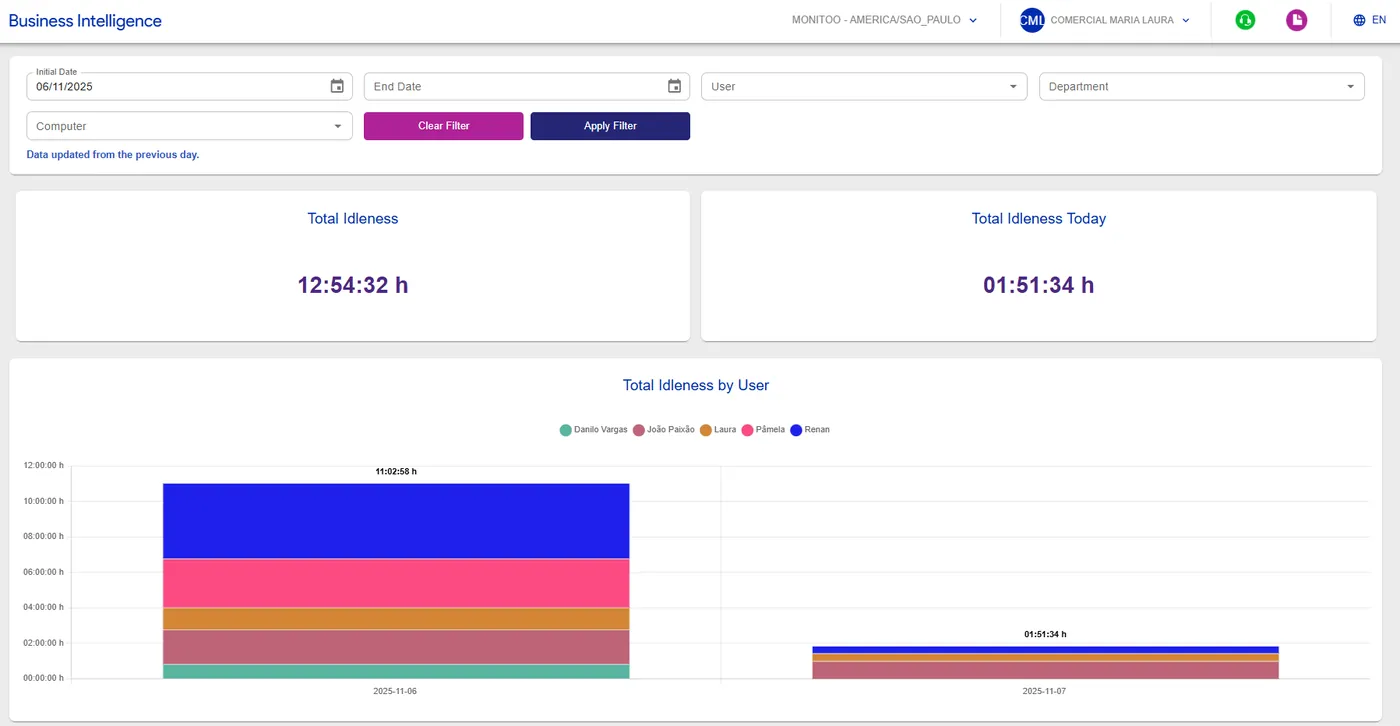
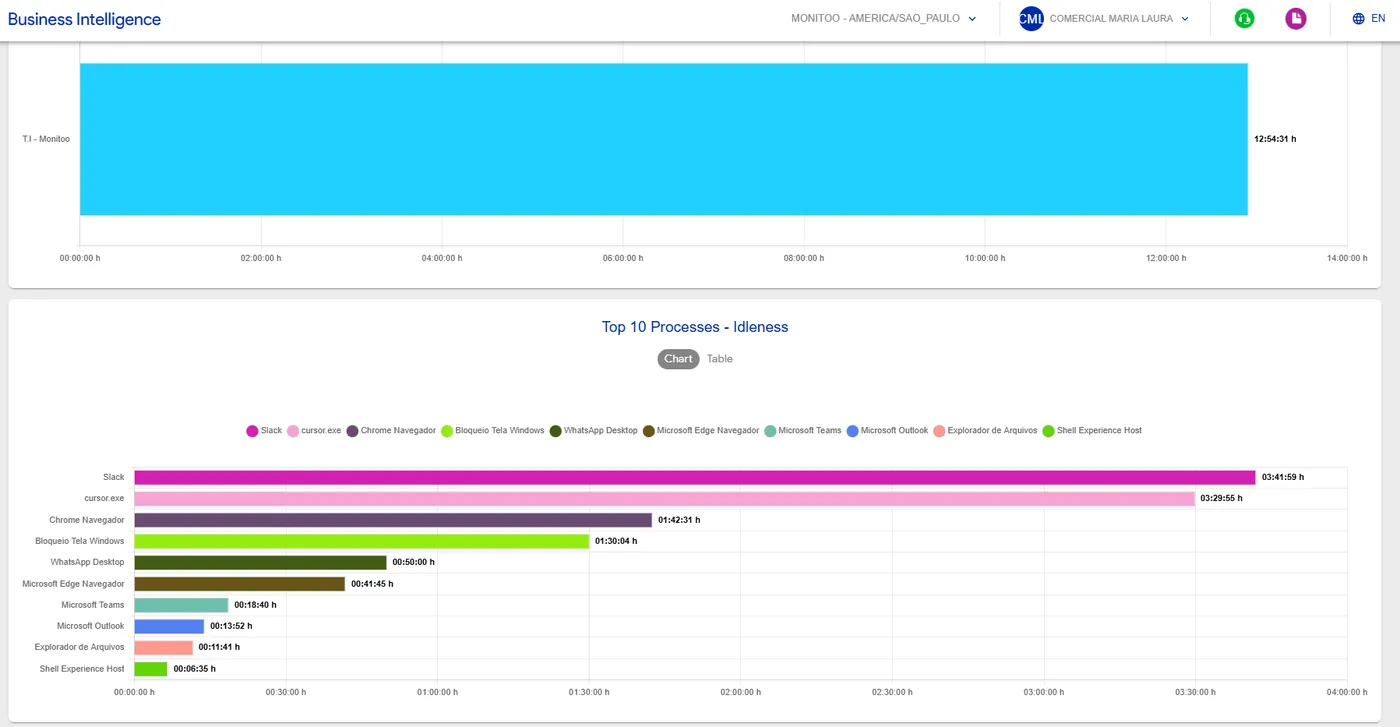
It presents detailed metrics such as: total idle time by department, total idle time by user, and the Top 10 most idle processes — with data collected from the previous day.
💡 Tip: Use the Idleness B.I. to identify bottlenecks, idle periods, and opportunities for operational optimization.
Was this article helpful?
Great! Thanks for your feedback.
Tell our team what was missing: contact support on WhatsApp.
